Data Engineering
IF5OT7 - 6 ECTS
“A scientist can discover a new star, but he cannot make one. He would have to ask an engineer to do it for him.” – Gordon Lindsay Glegg
Overview
The course aims at giving an overview of Data Engineering foundational concepts. It is tailored for 1st- and 2nd-year MSc students and PhDs who would like to strengthen their fundamental understanding of Data Engineering, i.e., data modelling, collection, and wrangling.
Origin and Design
The course originated from several courses taught at Politecnico di Milano (🇮🇹) by Emanuele Della Valle and Marco Brambilla. Its first edition as a unified journey into the data world was offered in 2020 at the University of Tartu (🇪🇪) by Riccardo Tommasini; it is still taught there by Professor Ahmed Awad (course LTAT.02.007). The course was subsequently adopted by INSA Lyon (🇫🇷) as OT7 (2022) and PLD “Data”.
Learning Objectives
Students of this course will obtain two sets of skills: one that is deeply technical and necessarily technology-biased, and one that is more abstract yet essential for working effectively in a data team.
Challenge-Based and Portfolio-Based Learning
The course follows a challenge-based and portfolio-based approach. Students work in groups to design and build a data product around an information need of their choice. The challenge is deliberately open-ended: the course defines a common engineering backbone, while each group decides what data to collect, what questions to answer, and what form the final data product should take.
All projects share the same minimum architecture:
Docker → Apache Airflow → Landing/Staging/Production → Star Schema → SQL Serving Layer → Jupyter Notebook
The minimum architecture is intentionally constrained so that projects remain comparable and students can focus on engineering decisions rather than technology accumulation. Additional systems (e.g., MongoDB, Redis, Neo4j, Kafka, PostGIS, vector databases, or search engines) may be included when they are justified by the product requirements. Using more technologies is not, by itself, evidence of a better project.
The teaching activities introduce the individual concepts and systems, but do not prescribe the full integration. Each group must decide how to connect the components, implement the required Airflow pipelines, document design choices, and discuss limitations and trade-offs.
Soft Skills
- Understand the role of the Data Engineer within a broader data team.
- Translate an information need into data requirements and engineering tasks.
- Justify architectural and modelling decisions using explicit trade-offs.
- Work effectively on an open-ended technical challenge.
- Present a data project to both technical and non-technical audiences.
- Write a concise post-mortem that discusses limitations, failed approaches, and lessons learned.
Creativity is part of the project design: students are encouraged to formulate an interesting information need and turn the engineered data into a product that is useful, understandable, or surprising.
Hard Skills
After a general overview of the data lifecycle, the course develops an opinionated view of modern analytical data architectures. Students work with data modelling, ingestion, wrangling, cleansing, transformation, orchestration, and serving.
At the core of the learning outcomes is the ability to design, build, operate, and explain a reproducible data pipeline.
Core technological choices (2026): Docker, Apache Airflow, SQL, and Jupyter notebooks.
The following systems and technologies are discussed during the course and may be used as justified extensions of the common project architecture.
- Data Formats
- JSON, CSV
- Parquet
- Relational Databases
- Postgres
- Document Databases
- MongoDB
- Columnar Stores
- DuckDB
- Key-Value Stores
- Redis
- Graph Databases
- Neo4J
The interaction with the systems above is primarily through Python and SQL, using Jupyter notebooks for exploration and serving. The environment is containerised with Docker and Docker Compose, while project pipelines are orchestrated with Apache Airflow.
Prerequisites
- Git and GitHub
- SQL and Relational Databases
- Python
Classwork
Syllabus
🖐️ = Practice 📓 = Lecture
- Intro Who is the Data Engineer + Data Lifecycle (📓)
- Docker Fundamentals (🖐️)
- Data Modelling (📓)
- ER (basics)
- Dimensional Modelling and Star Schema (basics)
- Data Formats: JSON, CSV, Avro, Parquet (🖐️)
- Data Orchestrations and Data Pipelines (📓)
- Apache Airflow (🖐️)
- Data Wrangling and Cleansing (📓)
- Pandas (🖐)
- Data Ingestion and Document Databases (📓)
- MongoDB (🖐)
- Caching and Key-Value Stores (📓)
- Redis or RocksDB (🖐)
- Querying: (📓)
- Postgres or SQLite (🖐)
- Advanced Querying: Wide Columns Stores and Graph Databases (📓)
- Cassandra or DuckDB
- Neo4J or Memgraph (🖐)
SCHEDULE
| Topic | Day | Date | From | To | Material | Video | Comment | |
|---|---|---|---|---|---|---|---|---|
|
Intro |
📓 |
Wednesday |
2026/09/23 |
10:00 |
12:00 |
|||
|
Docker |
🖐 |
Wednesday |
2026/09/23 |
14:00 |
16:00 |
|||
|
Airflow |
🖐 |
Thursday |
2026/09/24 |
14:00 |
15:00 |
|||
|
Data Modeling (OLTP) |
🖐 |
Monday |
2026/09/28 |
14:00 |
18:00 |
|||
|
Data Modeling (OLAP) - DuckDB |
🖐 |
Wednesday |
2026/09/30 |
14:00 |
18:00 |
|||
|
Document Stores (MongoDB) |
🖐 |
Monday |
2026/10/05 |
14:00 |
18:00 |
|||
|
Key-Value Stores (Redis) |
🖐 |
Wednesday |
2026/10/07 |
14:00 |
18:00 |
|||
|
Graph DBs (Neo4J) |
🖐 |
Monday |
2026/10/19 |
14:00 |
18:00 |
|||
|
Project In Class |
🖐🖐 |
Wednesday |
2026/10/21 |
14:00 |
18:00 |
LAST DATE TO REGISTER |
||
|
Project In Class |
🖐🖐 |
Monday |
2026/11/02 |
14:00 |
18:00 |
|||
|
Project In Class |
🖐🖐 |
Wednesday |
2026/11/04 |
14:00 |
18:00 |
|||
|
Project In Class |
🖐🖐 |
Monday |
2026/11/09 |
14:00 |
18:00 |
|||
|
Exam |
✍️ |
Wednesday |
2026/11/18 |
8:00 |
10:00 |
|||
|
Project Submission |
🏁 |
Monday |
2027/01/04 |
12:00 |
12:00 |
Submission via Repository (it counts the commit at 12:00) |
||
|
Poster Section |
🎭🍕 |
Tuesday |
2027/01/05 |
14:00 |
18:00 |
NB: The course schedule can be subject to changes!
Practices
Exam
The course exam takes place in class on the date indicated in the schedule and lasts around one hour. It includes 2–3 larger topics (data modelling, pipeline design, etc) and 3–5 shorter questions (simple questions about DE in general, e.g., what is ETL?).
You are allowed to bring one A4 sheet with as many notes as you can fit on it; the only requirement is that the notes are handwritten.
Projects
The semester project is the main challenge of the course. Each group designs and builds a data product: a useful artefact created from data through a reproducible engineering pipeline.
The project should start from an information need, not from a technology. Identify a domain, define who the product is for, and formulate 2–3 questions in natural language that the product should help answer. Then identify at least two meaningfully different data sources required to answer those questions.
“Different” may mean different formats, access patterns, update frequencies, data models, ownership, quality, or semantics. You must explain why the sources are complementary and why integrating them is necessary.
The architecture is constrained. The product is not.
All groups implement the same minimum engineering backbone, but the final product may be a retrospective, dashboard, explorer, decision tool, searchable resource, derived dataset, API, map, graph, or another well-motivated data artefact.
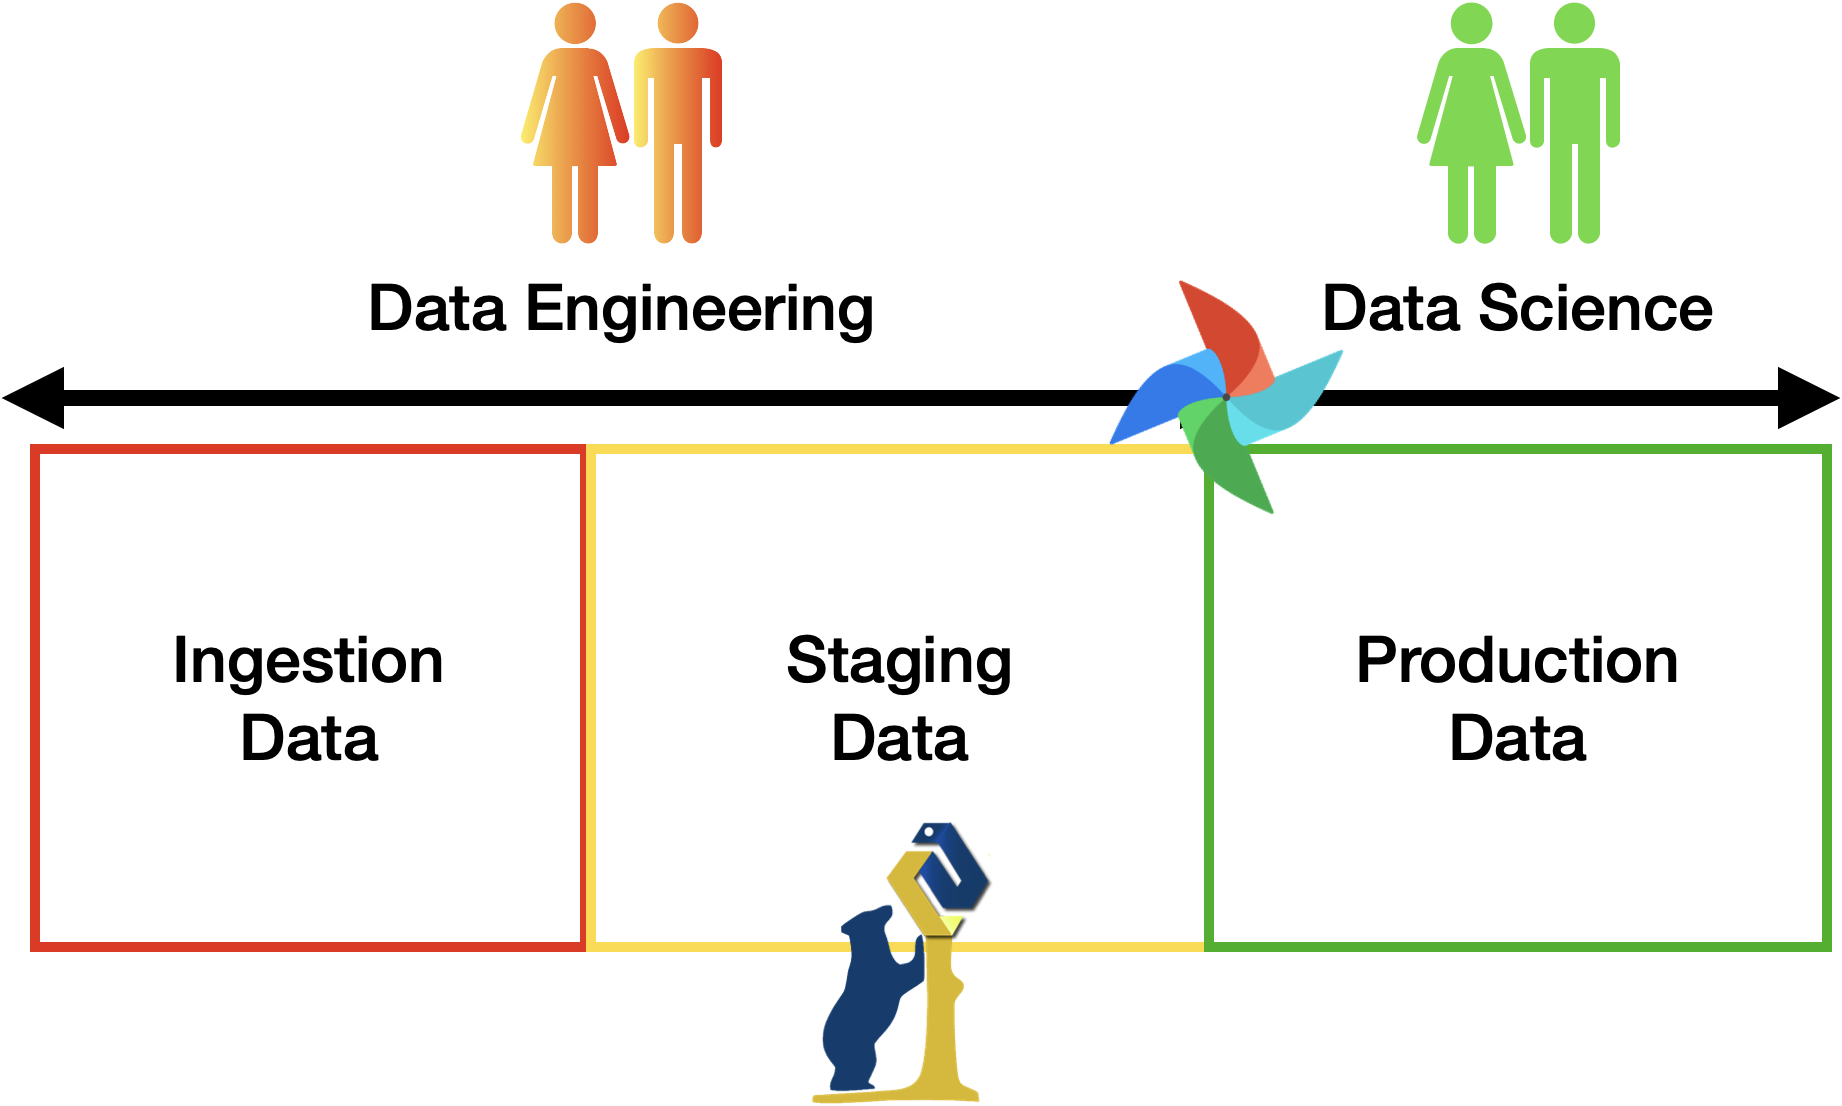
Minimum Architecture
Every project MUST implement the following baseline:
- Docker / Docker Compose for a reproducible execution environment.
- Apache Airflow for pipeline orchestration.
- Landing zone for ingested raw data.
- Staging zone for cleaned, validated, transformed, and integrated data.
- Production zone containing a dimensional model based on star-schema principles.
- A SQL serving layer exposing the information required by the product.
- A Jupyter notebook that queries the serving layer and demonstrates the main analyses or product logic.
Additional technologies are welcome when they solve a real requirement. A graph database may support relationship exploration; PostGIS may support spatial operations; Redis may support caching; Kafka may support streaming ingestion; a vector index may support semantic retrieval. These technologies extend the baseline architecture rather than replace it.
Pipeline Requirements
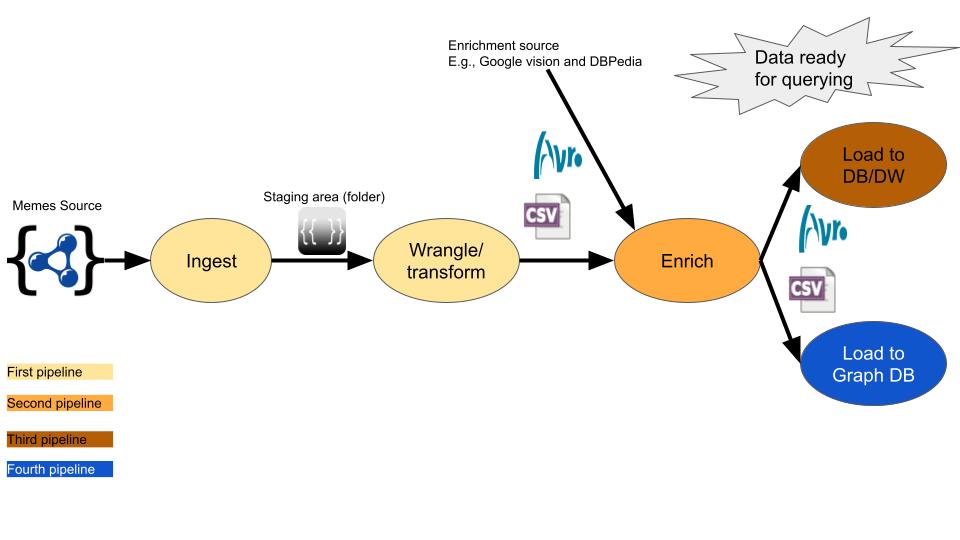
At minimum, the project must contain three logical pipeline stages managed by Airflow:
- Ingestion → Landing. Acquire data from the selected sources and store a raw or minimally modified representation. The project should make acquisition reproducible and document failure cases, rate limits, missing data, and other relevant source constraints.
- Landing → Staging. Clean, validate, normalize, transform, and integrate the sources. This stage should include explicit data-quality decisions and the enrichment/join operations needed by the product. Staging is persistent and must survive a restart of the Docker environment.
- Staging → Production. Build the curated analytical model, populate the star schema, refresh derived measures or data marts, and make the required information available through SQL. Production data is persistent.
The final notebook or product view must consume the serving layer, rather than bypassing the engineered pipeline by querying the original sources directly.
The figure below depicts the project structure using the meme dataset as an example.
A Taxonomy of Data Products
Projects are not required to produce the same kind of interface. The categories below are intended to broaden the design space; they are not grade levels. A technically strong retrospective may be better than an elaborate interactive product with a weak pipeline.
| Data product | Main question | Typical form |
|---|---|---|
| Retrospective | What happened? | Report, notebook, data story, annotated visualisation |
| Observatory | What is happening, and how is it distributed? | Dashboard, monitor, map, index |
| Explorer | What can I discover in the data? | Search, filtering, comparison, graph or spatial exploration |
| Decision Product | What should I choose given these conditions? | Recommendation, ranking, route, simulation, personalised answer |
| Data Artefact | What new object can be constructed from the sources? | Derived dataset, graph, index, API, score, model, generated representation |
The taxonomy can also be read as a spectrum of what the product delivers: from a fixed answer (retrospective), to a reusable view (observatory), to a space for user-driven questions (explorer), to an actionable answer (decision product), to a new reusable data object or service (data artefact). This is a spectrum of product form, not technical difficulty or grading level.
The visible interface may be simple. The purpose of the taxonomy is to encourage students to think beyond “dataset + dashboard” and to connect the product form to an information need.
Data Product Inspiration
The following projects illustrate different ways of turning engineered data into a product. They are provided as inspiration, not templates. The course does not evaluate students on reproducing their frontend complexity. Instead, look behind each interface and identify the sources, integration problem, transformations, model, and serving logic that make the product possible.
| Example | Product type | Product idea |
|---|---|---|
| Your summer reading list, based on the data | Explorer | Integrate many recommendation lists and resolve books into reusable entities |
| AI Evidence Database | Explorer / Data Artefact | Curated and searchable evidence base with provenance |
| Data Landscape | Data Artefact | Transform structured metadata and taxonomy into an explorable data artefact |
| Terrasses Barcelona — Sol i Ombra | Decision Product | Combine spatial and temporal data to answer a concrete situational question |
| Where the Shadow Fell | Data Artefact / Explorer | Derive an explorable historical/scientific dataset from raw astronomical data |
| Hail Mary — Star Map | Explorer | Turn a large scientific catalogue into an interactive exploration product |
| Le Baguette Index | Observatory | Build an observatory from difficult-to-collect real-world price data |
| Ask an Astronaut | Explorer | Transform interviews into a searchable question-oriented resource |
| Pentagon Pizza Index | Observatory | Turn changing external signals into a continuously updated indicator |
| Asteroid Tones | Data Artefact | Transform scientific event data into an unconventional sensory representation |
| Inner Dialogue · World Languages | Explorer | Integrate linguistic, geographic, and relationship data into an explorer |
| Billionaire Migration | Retrospective | Reconstruct and communicate movement from temporal/geographic data |
| Is AI Profitable Yet? | Retrospective / Observatory | Integrate heterogeneous public evidence around a focused analytical question |
| Football Data Portraits | Data Artefact | Turn event-level match data into a new visual representation of game dynamics |
A useful way to analyse any example is:
Information need → Sources → Ingestion → Cleaning → Integration → Transformation → Star Schema → SQL → Product
Portfolio and Evaluation
The project is evaluated progressively through three portfolio checkpoints. Each checkpoint adds evidence to the same repository rather than creating a disconnected submission. The portfolio is deliberately corrective: deficiencies identified at one checkpoint are discussed with the group, and students may address them in later submissions. Later evidence can therefore demonstrate that an earlier weakness has been understood and corrected.
The project portfolio is worth 110 points in total:
- Assignment 1 — Product and Data Design: 30 points
- Assignment 2 — Working Data Backbone: 40 points
- Final Defence and Poster Session: 40 points
The portfolio score is normalized to the course grading scale and averaged equally with the written exam to determine the final course grade:
Final grade = (Written Exam + Normalized Portfolio Grade) / 2.
Across the three checkpoints, the portfolio should provide evidence of: problem framing, source understanding, data modelling, pipeline correctness, integration and data quality, reproducibility, justified design decisions, product coherence, and communication.
Assignment 1 — Product and Data Design — 30 points
Demonstrate that the proposed challenge is interesting, feasible, and grounded in data.
The submission is a maximum of 3 pages, plus references. Concision is part of the exercise: the objective is to make the product and engineering problem understandable without writing a miniature thesis before any data has moved.
The portfolio should include:
- product name and one-sentence proposition;
- intended user or audience;
- 2–3 information needs/questions;
- at least two heterogeneous sources and their acquisition constraints;
- an initial data-quality and integration-risk analysis;
- the proposed architecture;
- a first dimensional model / star-schema sketch;
- a mock-up or sketch of the final product view.
The emphasis is on problem framing, source selection, modelling, and feasibility.
After evaluation, deficiencies are discussed with the group. Students are expected to document how important issues are addressed in the next iteration of the portfolio.
Assignment 2 — Working Data Backbone — 40 points
Demonstrate a functioning vertical slice of the architecture from source to serving layer. The portfolio should include:
- reproducible Docker environment;
- Airflow DAGs for the required pipeline stages;
- working ingestion from the selected sources;
- persistent staging and production zones;
- documented cleaning, validation, and integration rules;
- a populated star schema;
- SQL queries answering at least part of the original information need;
- a notebook that consumes the SQL serving layer;
- evidence that the project can run on a small offline sample dataset;
- a short account of which Assignment 1 deficiencies were corrected, deferred, or invalidated by new evidence.
The emphasis is on correctness, reproducibility, data quality, and end-to-end integration.
Deficiencies are again discussed with the group and may be corrected before the final defence.
Final Defence and Poster Session — 40 points
The final evaluation considers the complete portfolio and the finished product. Students should be able to explain and defend:
- the architecture and pipeline;
- data lineage from source to visible result;
- modelling and integration choices;
- data-quality decisions;
- limitations and trade-offs;
- any additional technology introduced and why it was necessary;
- what changed between the initial proposal and the final system;
- which deficiencies identified during the semester were corrected and how.
During the poster session, each group receives two short technical discussions:
- X minutes with the professor;
- X minutes with the teaching assistant.
The value of X is determined once the number of groups is known. Group order is randomized. Questions may start from the poster or product and follow the evidence back into the implementation. For example, students may be asked to select one value, figure, recommendation, or statement visible in the product and trace it backwards through the SQL serving layer, star schema, transformations, staging data, and original sources.
The poster session also includes invited external participants and the other students. They do not assign course grades. Instead:
- the external jury elects a Best Project using a standardized form;
- the students elect a Best Project / Audience Choice;
- these distinctions are honorary and do not modify the academic grade.
The final defence is also a social showcase, with food and small prizes for the awardees. The prizes are honorary and do not affect course grades.
The external jury considers only what can reasonably be understood from the poster and web/product view, focusing on clarity, usefulness, insight, and originality. Hidden technical complexity is evaluated by the teaching team, not by visitors.
The public-facing product view may be implemented with Jupyter/Voilà, Streamlit, Grafana, Observable, a small web application, or another appropriate interface. Frontend sophistication is not a substitute for data-engineering quality.
Portfolio Extensions
Once the minimum architecture works, groups may strengthen their portfolio with additional evidence. Examples include:
- a technology that is justified by a concrete requirement (e.g., Redis for caching, Neo4j for graph exploration, PostGIS for spatial operations, Kafka for streaming ingestion);
- stronger data-quality checks, lineage, provenance, monitoring, or recovery;
- incremental or near-real-time processing;
- performance measurements and justified optimisation;
- governance, privacy, licensing, or ethical analysis relevant to the chosen data;
- an unusually effective or creative data-product representation.
Additional tools do not automatically produce additional credit. What matters is whether the extension addresses a real requirement and whether the group can explain and evaluate the resulting design trade-off.
Project Minimal Submission Checklist
-
Repository with the code, well documented, including:
- Docker Compose configuration to run the environment;
- Airflow DAGs for ingestion, staging, and production;
- documentation of the sources, schemas, transformations, and data-quality rules;
- star schema and SQL serving queries;
- Jupyter notebook consuming the serving layer;
- instructions to reproduce the complete pipeline;
- a small example dataset so that the core project can be tested offline;
- a concise post-mortem describing limitations, failed approaches, and design trade-offs.
- Final poster explaining the problem, product, data sources, architecture, and one key result. The poster may also be produced in Markdown using Marp.
- Final web/product view for the public showcase.
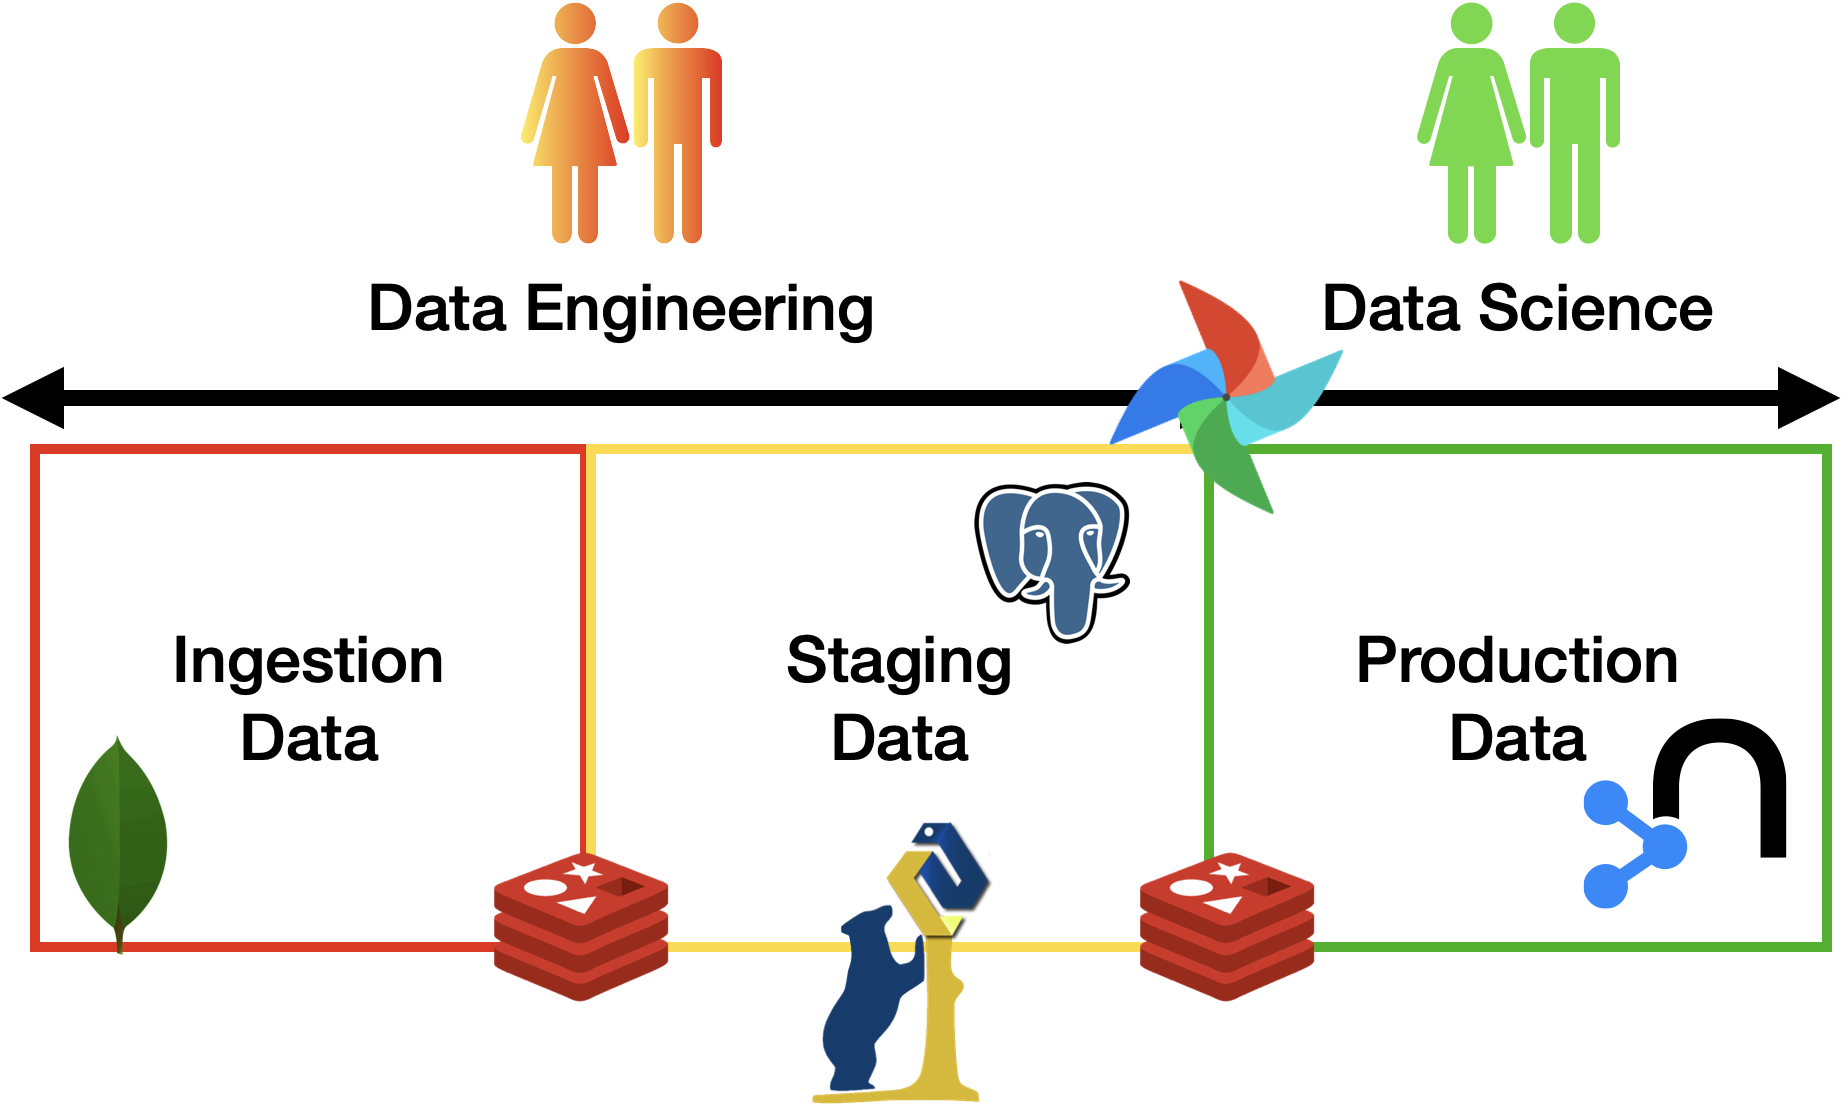
 Project Registration Form (courtesy of Kevin Kanaan)
Data Sources and Starting Points
The following resources can help you discover data, but a dataset is not a project. Start from an information need and use these sources only when they help build the product you have in mind. Every project must still justify and integrate at least two meaningfully different sources.
- Meme Dataset NOTE: analyses MUST SUBSTANTIALLY differ from the example!
- China Labour Bulletin
- GDELT (Real-Time)
- Aria Database for Technological Accidents (French Government, requires registration)
- Fatality Inspection Data
- Wikimedia Recent Changes (or others) (Real Time)
- Wikipedia:
Example Projects From Previous Years
FAQ
-
During ingestion, should we fetch data from the original source or manually download it first?
- The ingestion pipeline should normally acquire the data from the original source. A small local sample must also be provided so that the core project can be tested offline.
-
Should we filter data during ingestion?
- Prefer to preserve the raw source representation in the landing zone. Early filtering is justified when data must not be stored at all, for example because of privacy, licensing, security, or volume constraints. Document such decisions.
-
Should staging data be persistent?
- Yes. Progress should survive a restart of the Docker environment.
-
Should landing data be persistent?
- Not necessarily. The landing zone may be transient, but the design must account for replay, duplicate ingestion, and source unavailability.
-
What should be true at the end of staging?
- Staging should contain validated and normalized data suitable for integration and downstream modelling. Known quality limitations should be explicit rather than silently hidden.
-
Can we replace the star schema with Neo4j/MongoDB/etc.?
- No. The star schema and SQL serving layer are part of the common minimum architecture. Additional systems may extend the project when they serve a justified product requirement.
Related Books
- Foundation of Data Engineering
- Data Pipelines with Apache Airflow
- Designing Data Intensive Applications
- Seven Databases in Seven Weeks
Previous Editions
Enjoy Reading This Article?
Here are some more articles you might like to read next: