Data Engineering Foundations
IF.5.OT.7 - ECTS 3.0 - Repo
SCHEDULE
| Date | Day | Hours | A/M | Type | Content | Material | Comment |
|---|---|---|---|---|---|---|---|
| 28/09 | Wednesday | 4 | A | CM | Into: Who is the Data Engineer + Lifecycle | Slides | Docker installation for some |
| 03/10 | Monday | 2 | A | CM | Apache Workflow Intro + TD | Slides | Demo Ariflow |
| 04/10 | Tuesday | 2 | M | CM | Data Wrangling | Slides | Demo Ariflow repo/wrangling cheatsheet |
| 05/10 | Wednesday | 4 | A | TP | TP Pipelines/Wrangling | Airflow Pandas | solution airflow solution pandas |
| 17/10 | Monday | 4 | A | CM | Physical Pipelines + Practice (MongoDB) | Slides | |
| 18/10 | Tuesday | 2 | M | TP | Practice (MongoDB) | Slides MongoDB | solution mongo |
| 19/10 | Wednesday | 4 | A | TP | Key Value Stores + Practice (Redis) | Slides Redis | solution redis |
| 24/10 | Monday | 4 | A | TP | Graph DBs + practice (Neo4j) | Slides Neo4J | solution neo4j |
| 25/10 | Tuesday | 2 | M | CM | Streaming Data Eng | Slides | |
| 26/10 | Wednesday | 4 | A | TP | Project Bootstrap | ||
| 15/11 | Tuesday | 4 | M | TP | MCQ + Seminar on ENSAD | ||
| 21/11 | Monday | 4 | A | TP | Project TP | ||
| 22/11 | Tuesday | 4 | A | TP | Project TP | ||
| 23/11 | Wednesday | 4 | A | TP | Project TP + Submission |
NB: The course schedule can be subject to changes!
Related Books (Not Necessary for the Course)
- Foundation of Data Engineering
- Data Pipelines with Apache Airflow
- Designing Data Intensive Applications
- Seven Databases in Seven Weeks
Projects 2022
You should identify a domain, two different data sources, and formulate 2-3 questions in natural language that you would like to answer.
“Different” means different formats, access patterns, frequency of update, etc. In practice, you have to justify your choice!
If you cannot identify a domain yourself, you will be appointed assigned on by the curt teacher.
The goal of the project is implementing a full stack data pipeline that goes from raw data to simple visualisations (not part of the evaluation).
The final frontend can be implemented using Jupyter notebook, Grafana, or any software of preference to showcase the results. THIS IS NOT PART OF THE EVALUATION!
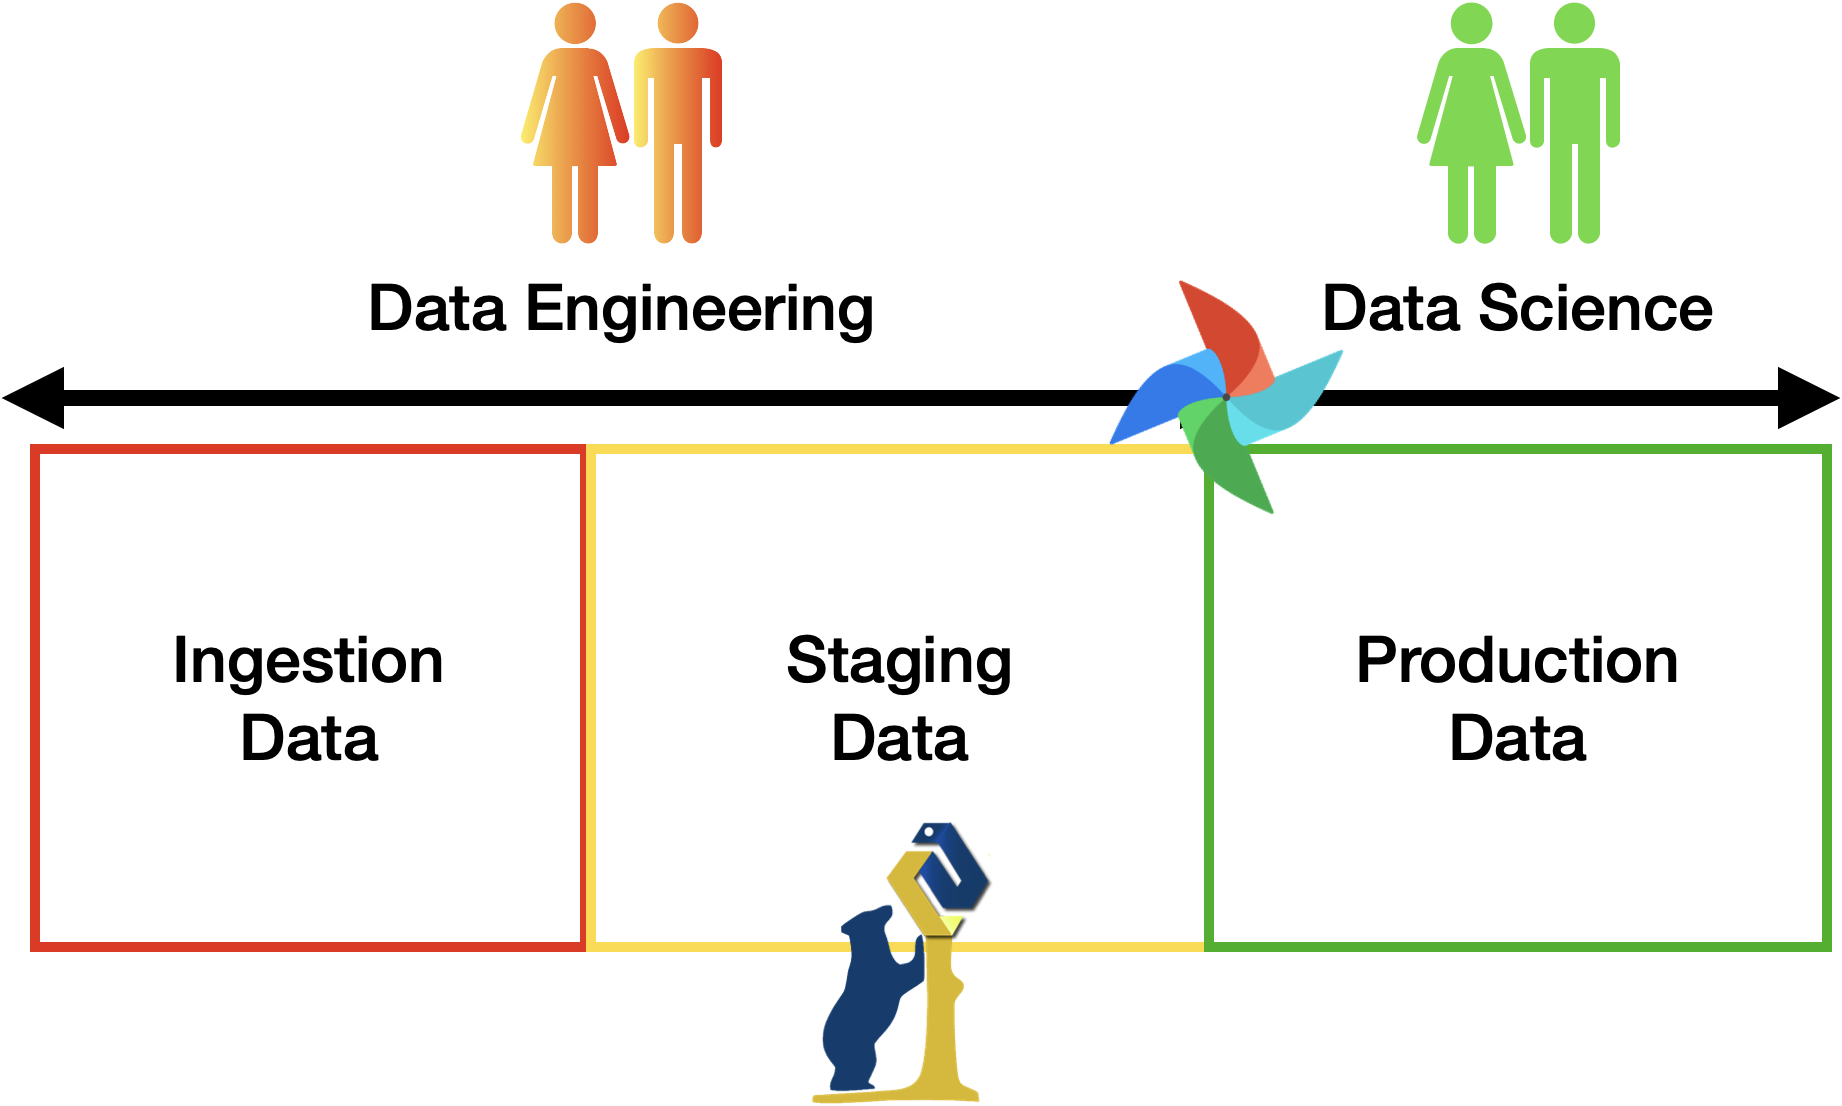
The pipeline MUST include all the three areas discussed in class (see figure above), i.e., ingestion of (raw) data, staging zone for cleaned and enriched data, and a curated zone for production data analytics. To connect the various zones, you should implement the necessary data pipelines using Apache Airflow. Any alternative should be approved by the teacher. The minimum number of pipelines is 3:
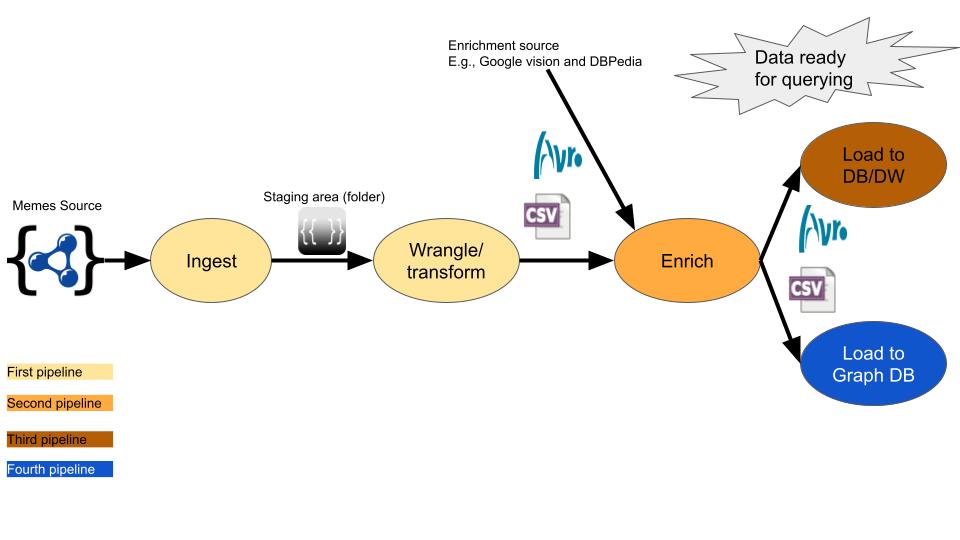
- A first pipeline is responsible to bring raw data to the landing zone. Such pipeline is supposed to ingest data from the source identified at first and bring them to a transient storage.
- A second pipeline is responsible to migrate raw data from the landing zone and move them into the staging area.
In practice, the second pipeline is supposed to
- clean the data according to some simple techniques saw in class (extra techniques are welcome yet not necessary)
- wrangle/transform the data according to the analysis needs (the questions formulated at first)
- enrich the data by joining multiple datasets into a single one.
- persist data for durability (the staging zone is a permanent): i.e., resit to a reboot of your (docker) environment.
- The third/fourth pipeline are responsible to move the data from the staging zone into the production zone and trigger the update of data marts (views). Such pipeline shall perform some additional transformation and feed the data systems of choice for populate the analysis.
- The production zone is also permanent and data shall be stored to prevent loss.
- such pipeline is also responsible to launch the queries implemented according to one of the analytics languages of choice (SQL/Cypher)
- If you are using SQL, the final database should follow the star schema principles
- for the graph database instead it is sufficient to implement the queries.
The figure below is meant to depict the structure of the project using the meme dataset as an example.
Project Submission Checklist
-
repository with the code, well documented, including
- docker-compose file to run the environment
- detailed description of the various steps
- report (Can be in the Repository README) with the project design steps (divided per area)
- Example dataset: the project testing should work offline, i.e., you need to have some sample data points.
- slides for the project presentation. You can do them too in markdown too.
Project grading 0-10 + 5 report (accuracy, using proper terminology, etc) + 5 for presentation
- up to 10 points for the pipeline design
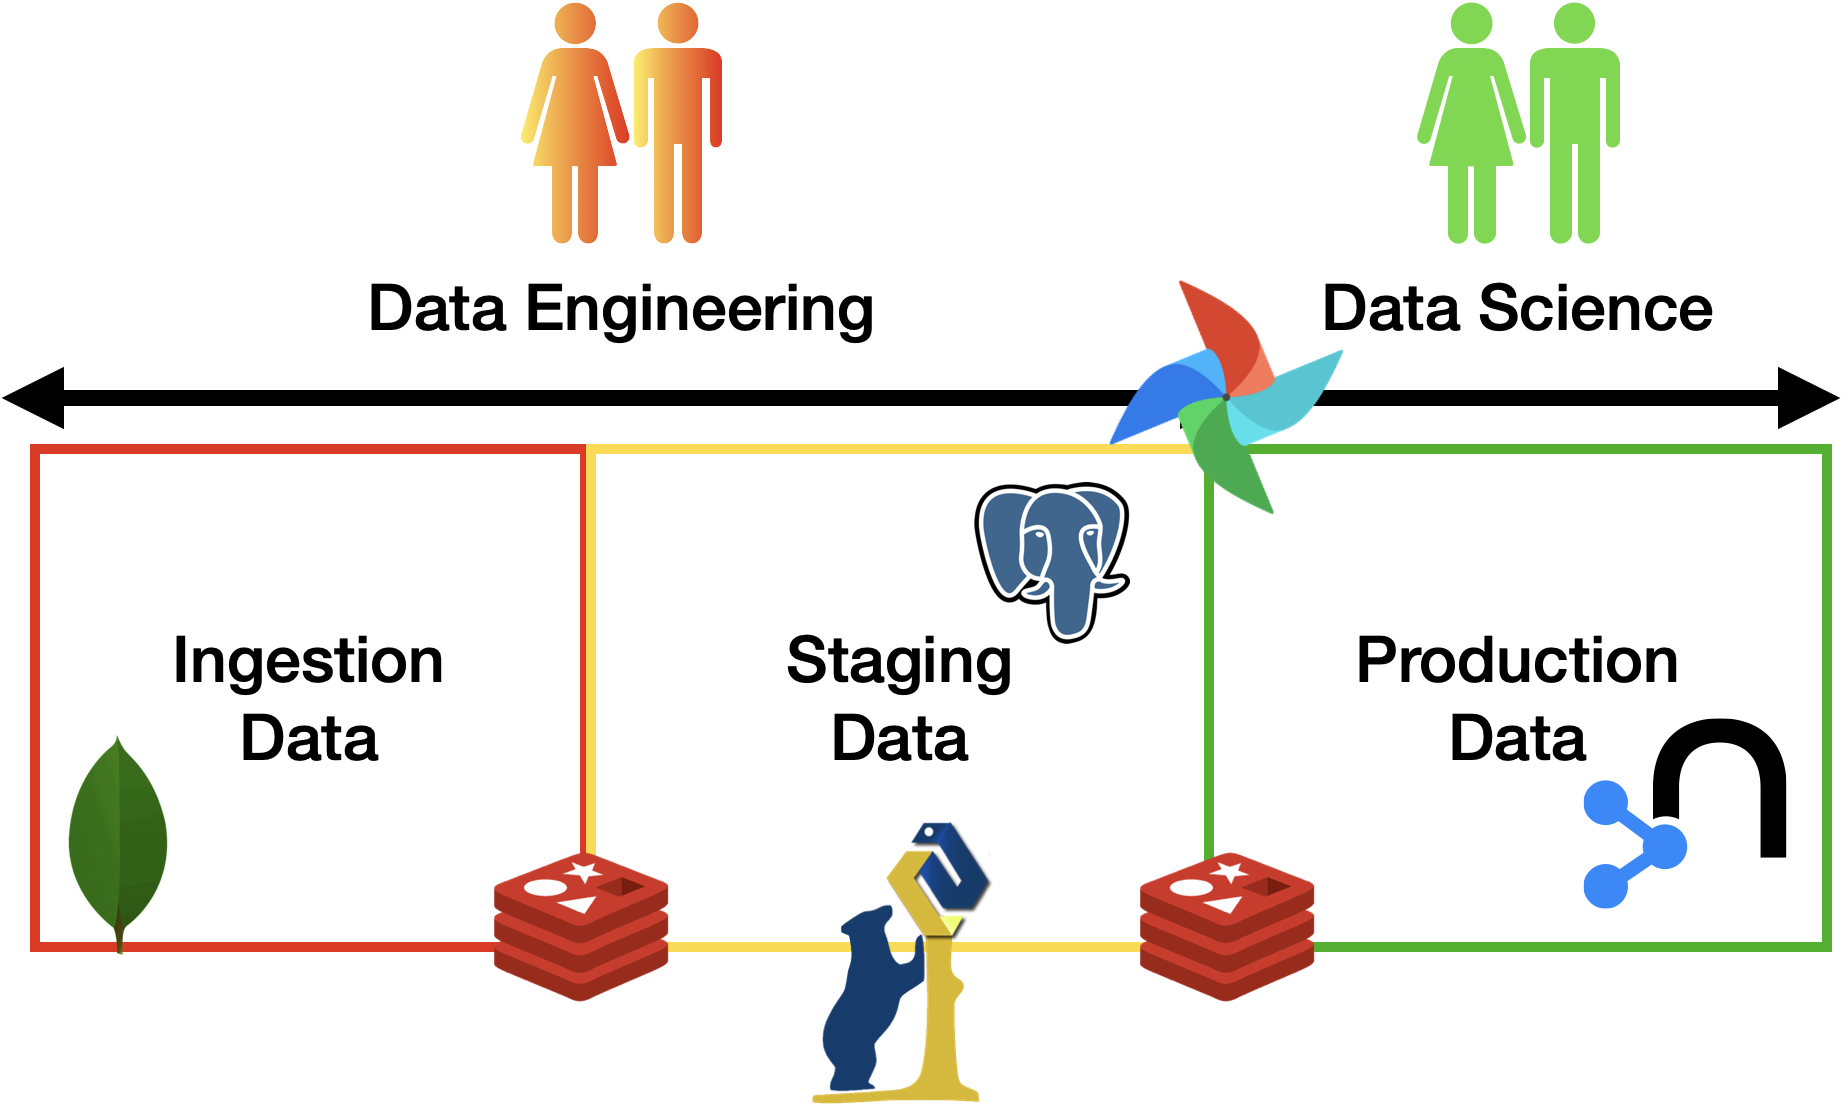
- using airflow + pandas + mongodb + postgres + neo4j (any deficiency MUST be justified!)
- +1 points using REDIS for speeding up steps
- +1 points STAR schema design includes maintenance upon updates
- +1 creativity: data viz, serious analysis, performance analysis, extensive cleansing.
- +1 launching docker containers via airflow to schedule job
- +1 using kafka for ingestion and staging (also + docker)
Detailed Description of each pipeline for the Meme Example Project
First of all, you have to pick some of the memes entries and make yourself familiar with them
In the following, I am suggesting some actions in each phase. You have to come up with your own. Most of the actions (transformations) will be driven by the type of queries you need to run against the data at the end.
Cleansing
- You may want to drop the category attribute as all report the same value “meme” so nothing to learn further from this attribute.
- Maybe, you want to exclude memes whose title or description use improper words. You have to come up with these words or use some ready-made tool that tells you if the input text uses some improper language.
- It might be the case that several json objects refer to the same meme, you can pick the most recent one only by sorting by the “last_update_source” attribute.
- May attributes deliver the same information like “twitter:description” and “og:description”, you need to keep only one.
Transformations
- You may want to extract the links attribute to further connect memes in a graph or relational view on the data.
- Similarly, you may want to extract the tags of each meme.
- In the spread.links attribute, you can collect the major web apps that have been used to spread this meme. These can be used for future categorical queries.
- You may want to count the spread.images entries. This can be an indicator on the number of variants of this meme.
- Keep the source and the year of creation.
- External references text and links
- You can compute similarity between memes descriptions using APIs like Dandelion API
Enrichments
- You can pass the image of the meme to Google API to enrich the meme like it contains a human, animal, object, etc.
- We have already a dataset with this data added to each meme, you can make joins with the raw data set or upload it into some DB for faster querying.
Queries
This phase should be actually the first thing you start with. Because, it will affect how you design your pipeline. After you make yourself familiar with the data, you may think about queries like:
- Show the number of the memes per year in ascending order.
- Which memes have the largest number of common tags?
- Is it possible to find two memes that have their description similarity about x% but have different tags?
Pre-Approved Datasets
- Meme Dataset NOTE: analyses MUST SUBSTANTIALLY differ from the example!
- China Labour Bulleting
- GDELT (Real-Time)
- Aria Database for Technological Accidents (French Government, requires registration)
- Fatality Inspection Data
- Wikimedia Recent Changes (or others) (Real Time)
- Wikipedia:
FAQ
-
While ingesting the data do we pull it from the internet or download it on our computer and then import it?
- The ingestion part is about downloading and fetching the data so go get it on internet.
-
Do we filter the data in ingestion?
- It depends, sometimes you may want to filter the data, especially when sensitive data is collected adn should be censored / removed.
-
Should data be persistent in the staging phase?
- Yes, if staging stops at any moment, progress should not be lost/
-
Should data be persistent in the ingestion phase?
- It’s not mandatory, but keep in mind that persisting data comes with its own challenges, you might risk ending up with duplicate saved data.
-
What is the data goal at the end of the staging phase?
- At the end of the staging phase you should only have clean data. ie: no data in pulled from there leads to an error